


My Role
Product Designer
Objective
Turn a passive transaction viewer into an active system that helps users understand and act on their spending behavior
What this is
A conceptual redesign introducing an abstraction layer over raw financial data, shifting from transaction logs to insight-driven understanding
Outcome
Enables users to instantly interpret spending patterns, trends, and category behavior without manual effort, shifting experience from “read data” → “understand behavior”.
Background
I use Paytm frequently, and like most UPI-heavy users, it already has a complete record of my financial activity. But when I check my spending, the experience stops at showing me transactions.
I can see totals. I can see categories. But I still have to do the thinking myself.
Did I spend more this month than last?
Which category is increasing over time?
Am I overspending somewhere consistently?
None of these are answered directly.
The system surfaces data, but not meaning.
Who this is for
Paytm’s spend tracking aggregates transactions into monthly totals and category splits, with drill-down to transaction history. But it stops at presenting data, not helping users like me understand or act on it.
It was obvious the problem isn’t lack of data, but the lack of abstraction.
The Gap
Paytm already captures everything needed to help users manage their money. But the current experience:
Aggregates transactions into monthly totals
Splits them into categories
Allows drill-down into history
…and stops there.
It behaves like a ledger. Not like a system that helps users understand their financial behavior.
Solution
The core idea was to shift from transaction-first tracking to insight-first understanding Instead of asking users to interpret data, the system should do that work for them.
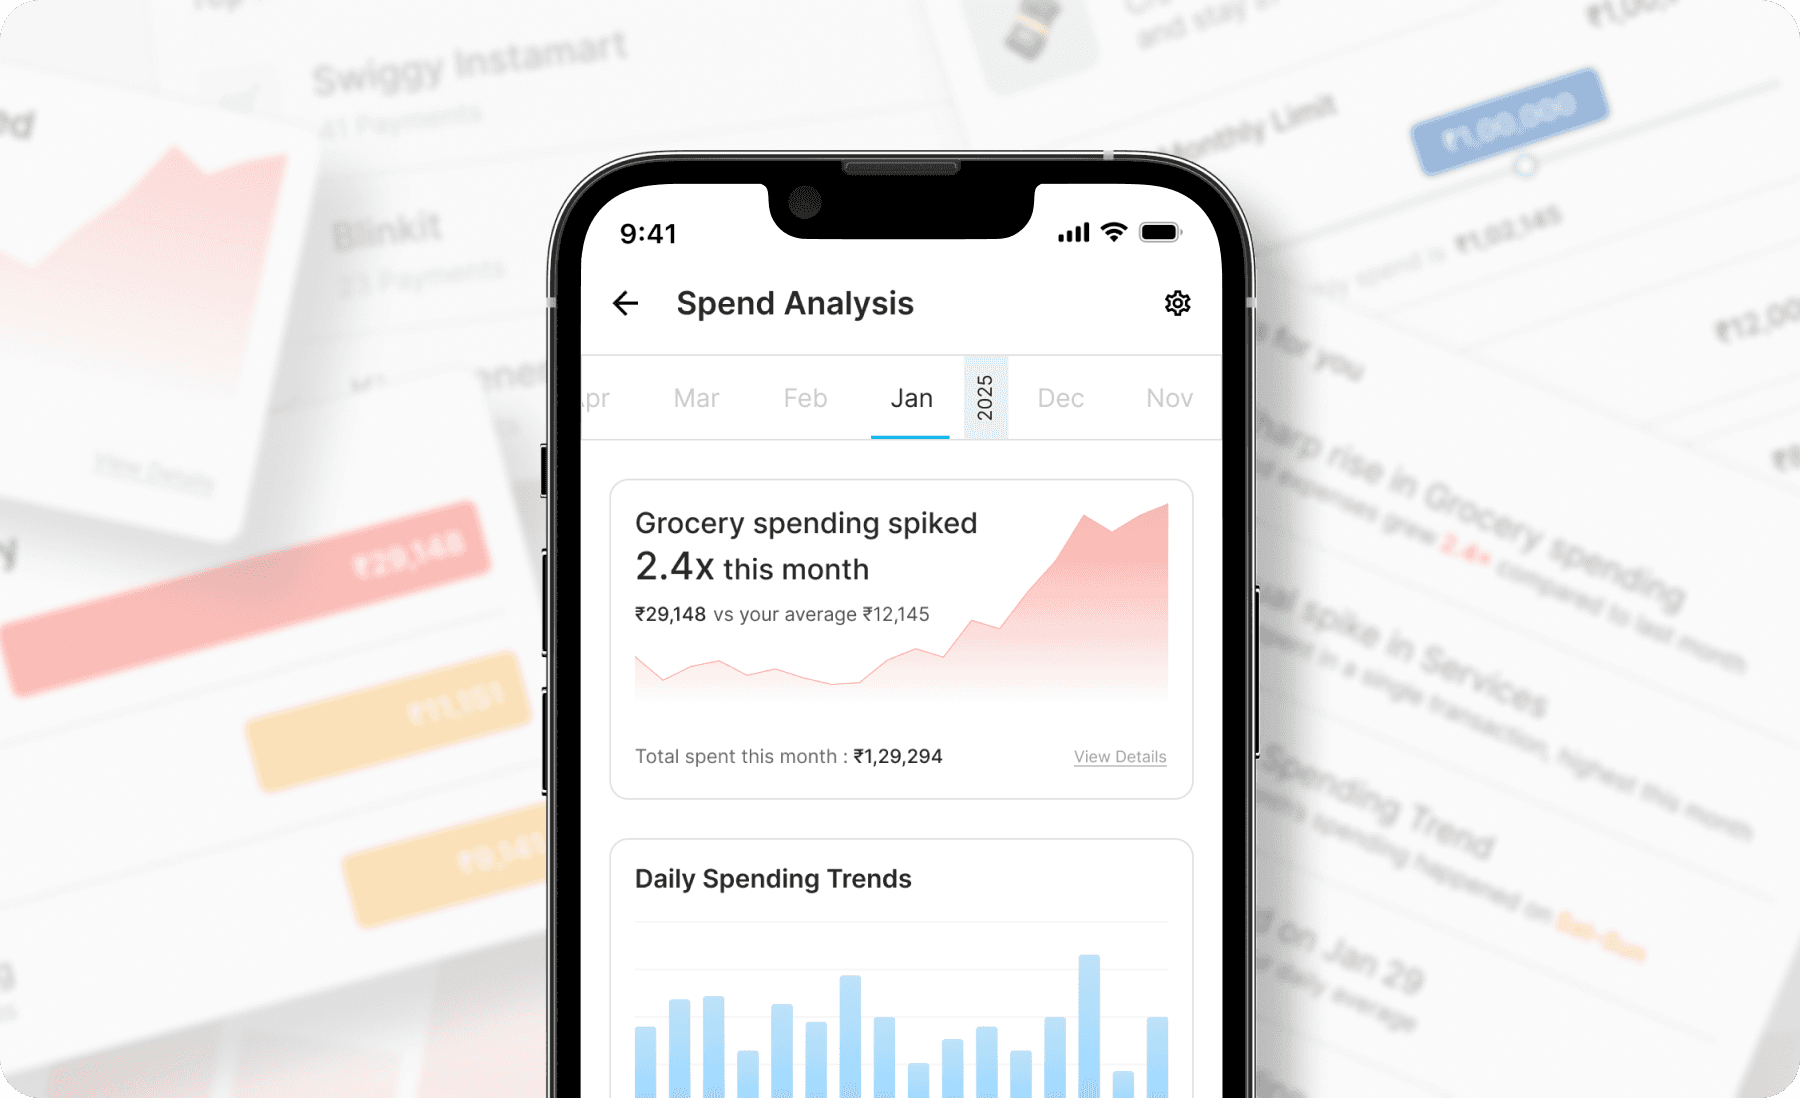
Quick Understanding
Most users don’t want to analyze data, they want a quick answer to “What’s happening with my money?”
The entry experience is redesigned to surface high-signal summaries upfront
Key spend spikes and comparisons
Category-level highlights
Immediate visual cues of change
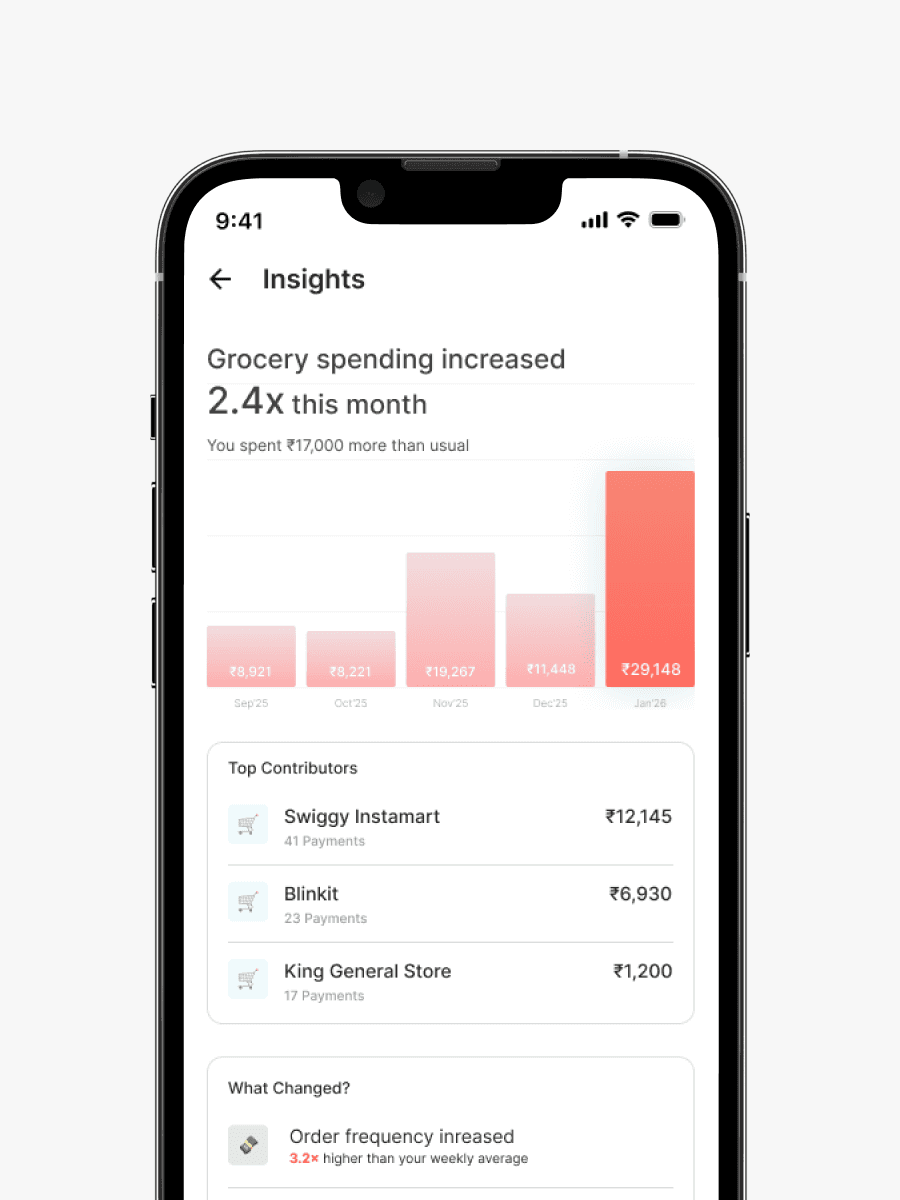
Entry → Insights
This leads into an insights layer that:
Explains what changed
Identifies top contributors
Quantifies deviations from usual behavior
The system moves from showing totals to answering questions instantly.


For users who want to go deeper, the experience enables exploration of
“When and how is this happening?”
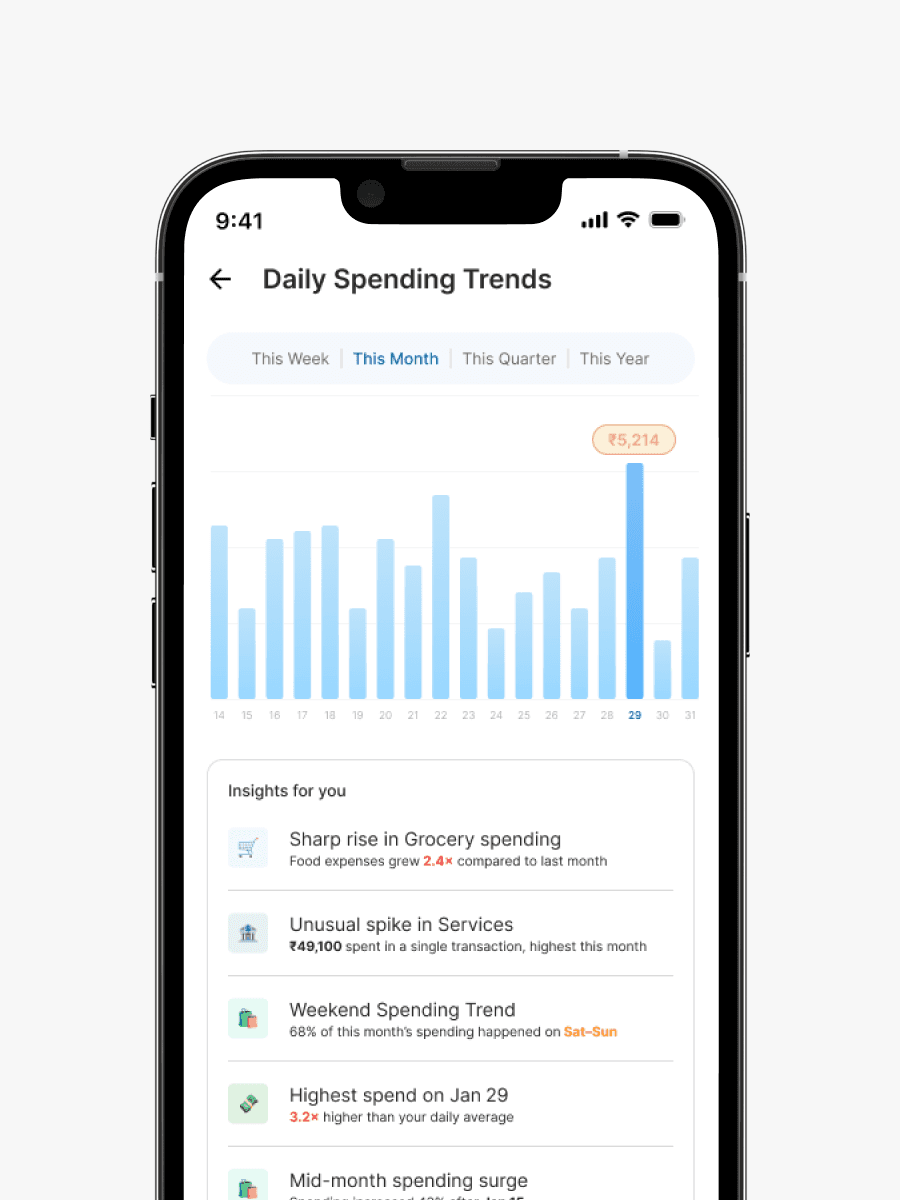
A dedicated trends layer introduces:
Daily spend patterns
Temporal spikes and anomalies
Contextual insights tied to specific moments
Entry → Trends → Insights
Instead of static category summaries, users can:
Trace behavior over time
Identify irregular spending days
Understand frequency vs value shifts
Insights are not isolated, they are grounded in visible patterns, making them more trustworthy and interpretable.


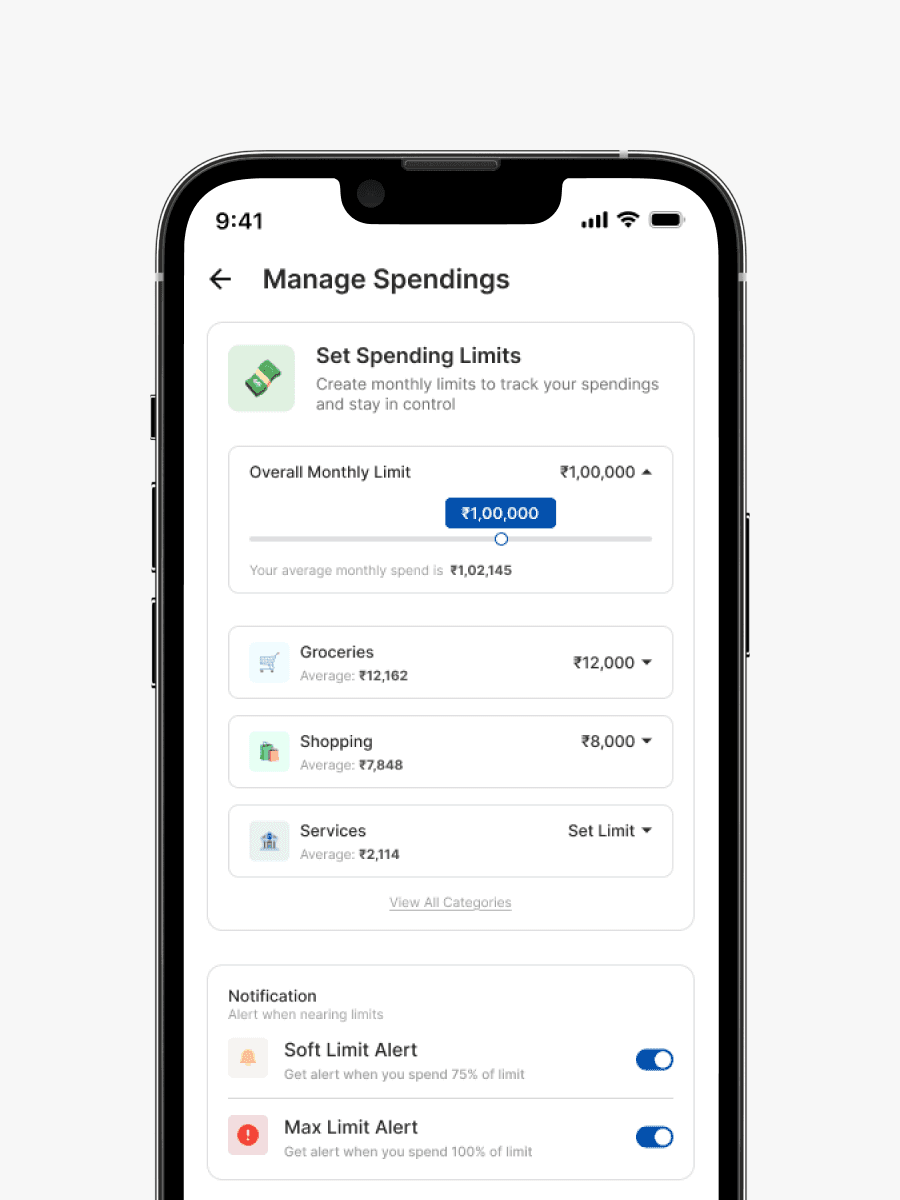
Understanding alone is not enough—the system enables users to act on it.
From insights, users can directly transition into a control layer where they can:
Set overall and category-level limits
Configure alerts based on thresholds
Align limits with observed behavior
Entry → Manage Spendings
This closes the loop:
From awareness → to intervention
The experience evolves from a tracker into a lightweight financial control system embedded within Paytm.


This system can evolve beyond temporal insights into spatial understanding of spending.
Mapping transactions by location can surface patterns through heatmaps, showing where money is consistently spent, not just when or on what.
This opens up opportunities to:
Help users identify high-spend zones (e.g., frequent areas of discretionary spend)
Enable smarter, context-aware nudges based on location behavior
At a broader level, this layer can extend into B2B use cases, powering merchant analytics, local demand insights, and hyperlocal financial behavior patterns.